Strategic Tips for Energy Management with Power BI
Could you benefit from adding a BI system to your Energy Management toolbox?
Power BI is designed to extract data from various sources so that you can easily analyze data, identify trends, and make more informed decisions. However, before you can start using Power BI for your energy management, you need to decide what data to use, where it’s located, and how it should be managed. In this article, we will summarize some strategic tips for energy management in Power BI, so that you can make the most out of the system.
What is Power BI?
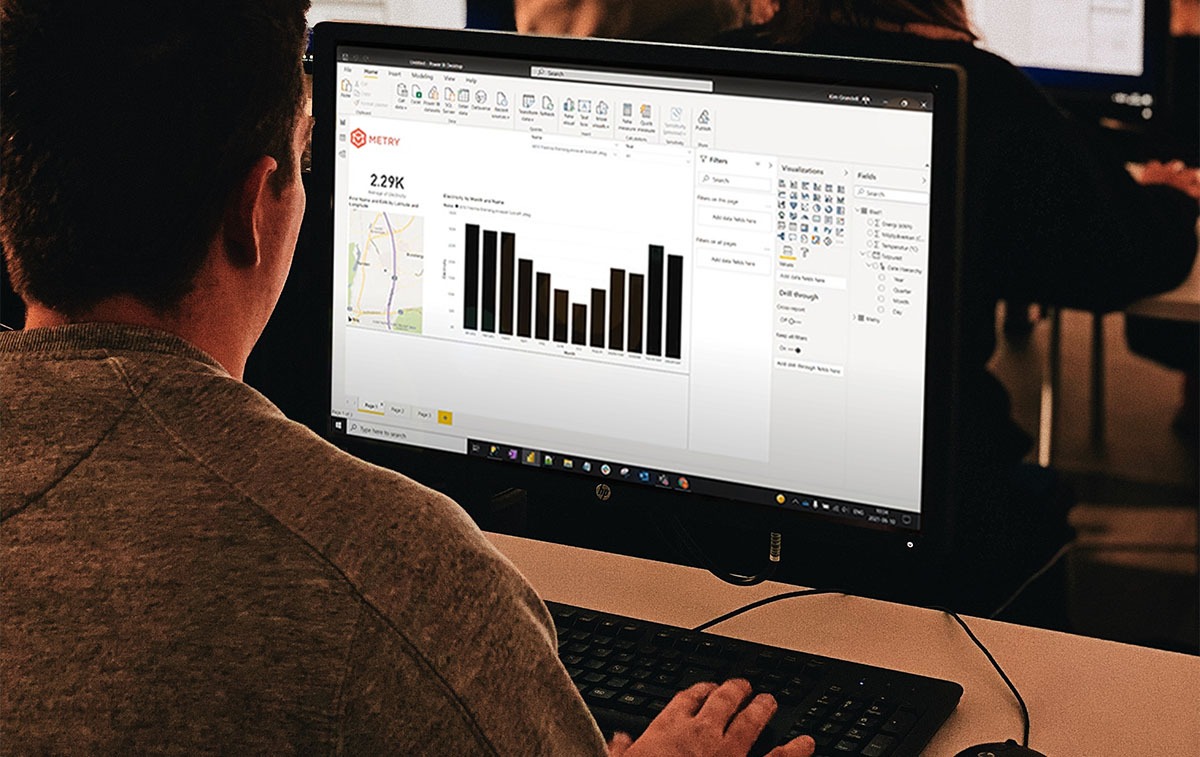
Power BI is a leading data analytics and visualization tool from Microsoft that allows you to create clear reports to gain new insights and make more informed decisions. With the tool, you can take a more flexible and data-driven approach to energy management. Power BI enables you to customize how you want to visualize and analyze your data from both Metry and other data sources.
The thing that’s so convenient about Microsoft Power BI is that most organizations already have access to the tool through Office packages. Therefore, many property owners and property management companies choose to supplement their existing systems with Microsoft Power BI, for purposes ranging from Energy Management and ESG Reporting to internal KPI tracking and budgeting.
Behind all the graphs and visualizations lies a lot of data, and to be able to use it, you need to get a handle on where it is, who has access to it, and how it should be managed. Here, we share three tips on how to lay a good foundation for energy management with Power BI!
Tip #1: Visualize with the Proptech Stack
Where is your data?
It’s easy to present data in Power BI because the system is designed to extract data from various sources. In addition to tracking your data from Metry, you can also track data from various tenant surveys or key performance indicators for finance and accounting, for example.
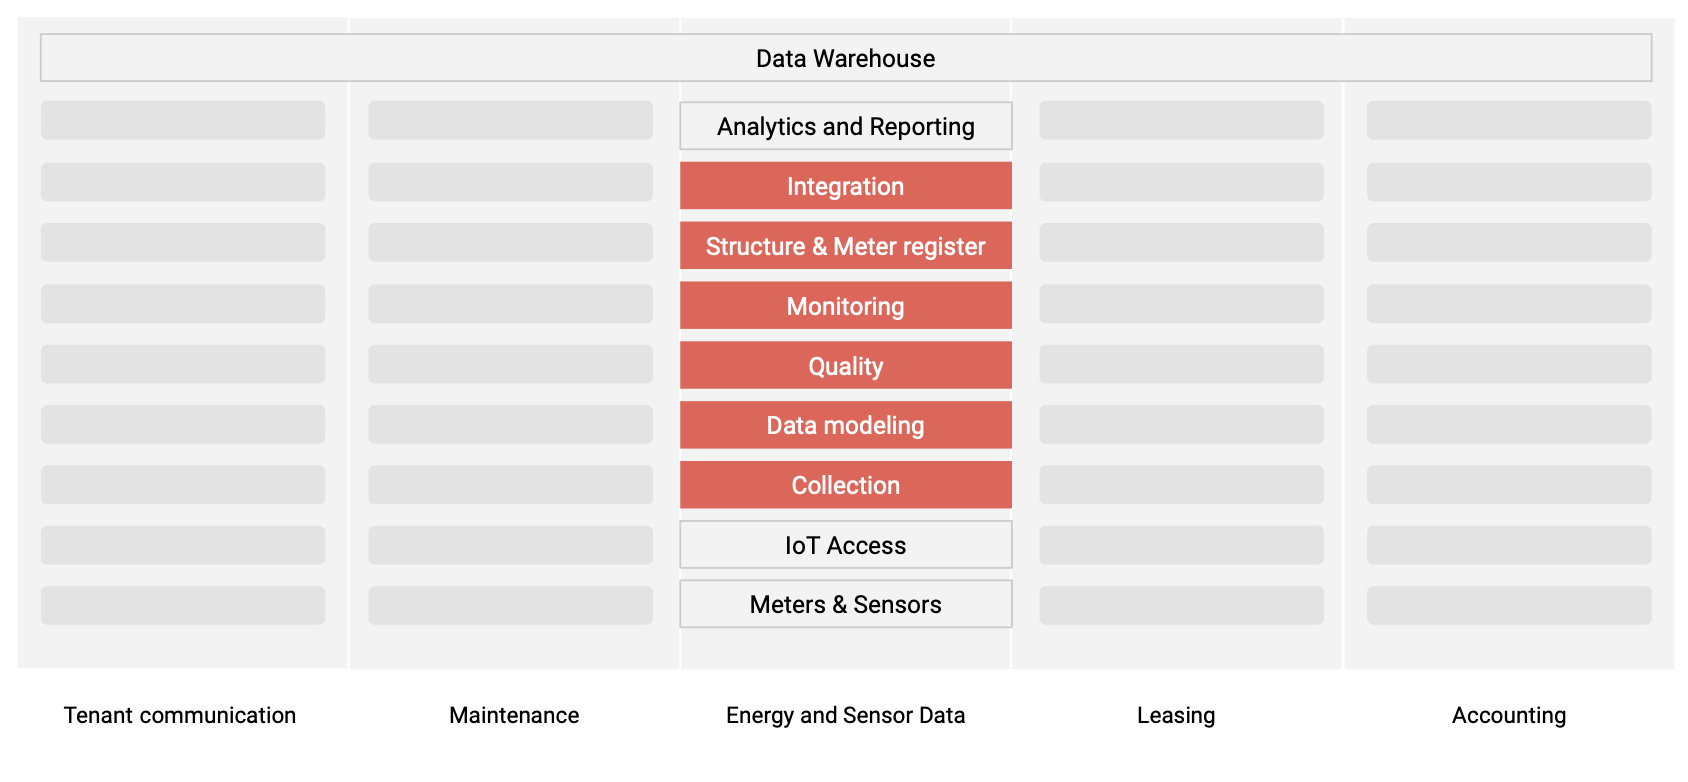
However, the ease of connecting to many different sources can also quickly become overwhelming, and the larger the project, the greater the risk of getting stuck or messing things up. To avoid this, you should first get an overview of all the data sources that you have access to and may want to use in your reports. To make it simple, you need to visualize your technical infrastructure – like in this image:

We call this technical infrastructure the Proptech Stack, which includes five verticals, each representing different functions in the business:
- Tenant communication
- Maintenance
- Energy and sensor data
- Leasing
- Accounting
Above all these, we have the data warehouse (in this case Power BI) that consolidates data from all different verticals. By going through the different verticals and documenting the systems you use, you can see what data you have access to, and evaluate how you can obtain it.
Tip #2: Own your data and the access to it
How do you get your data?
It may seem obvious, but in order to analyze your data in Power BI, you need to be able to extract it from the systems you have identified in the Proptech Stack. That’s why it’s crucial that you own your data.
All data does not have to be physically stored in your database, it is perfectly okay to store the data with subcontractors – that is how the IT landscape works today, and it’s actually the safest way. What you do need to ensure is that you can extract your data from your subcontractors.
If you ask the question “can we extract the data from your system?” you will always get the answer “yes”. But the actual process to do so can be expensive, complicated, time-consuming, and it may never be as good as you expected. So instead, you need to ask “what does it cost to export the data to Power BI?” and “how long will it take?”. Be specific and make demands on the subcontractor.
With Metry, you always own your data and the right to export it. That’s a fundamental principle for us. You can always export your data directly from the Metry portal, or create custom exports with our API.
Tip #3: Use Power BI as a secondary data source
How should you handle your data?
It may be tempting to connect your data sources directly to Power BI, or to import files directly from the utility provider. But what happens when there are errors in the readings that need to be corrected? Suddenly, Power BI becomes a primary data source where you’re also handling data collection, modifying values, troubleshooting, and making estimates for missing data, and important aspects such as quality and structure are lost. You wouldn’t let Power BI be the primary data source for something like accounting, would you?
Let’s say you want to compare a building’s net operating income with its energy consumption. Then, you need to export the net operating income data from your accounting system, and your energy data from Metry to combine them in Power BI. If you discover an error in the net operating income data, you wouldn’t change it in Power BI. Instead, you would change it in your accounting system. And just like with accounting, Power BI shouldn’t be the primary data source for energy data.
Do your accounting in the accounting system and your data collection in the collection system – and analyze in Power BI.
Start monitoring Energy use in Power BI
If you’re collecting data with Metry, you already have everything you need to track your energy use in Power BI! And if you’re new to Metry, it’s easy to get started. Contact us if you want to start collecting your energy data with Metry.
See Metry in action
Talk to an expert
All your questions answered, no strings attached.
See how the data collection works, talk about the big picture, or get down to the technical nitty-gritty – it’s up to you!
Schedule a chat with us and we’ll help you find the best data collection set-up for your needs.
Can’t see the form? Try turning off your ad blocker.